Overview
Week 1: January 24-31, 2022
Nothing that you will learn in the course of your studies will be of the slightest possible use to you in after life, save only this, that if you work hard and intelligently you should be able to detect when a man is talking rot, and that, in my view, is the main, if not the sole, purpose of education.
John Alexander Smith, Philosopher, 1914 Speech to Oxford University students.
This course oscillates between two opposing perspectives of data-driven thinking: an optimistic one and a skeptical one, often settling somewhere in between the two poles.
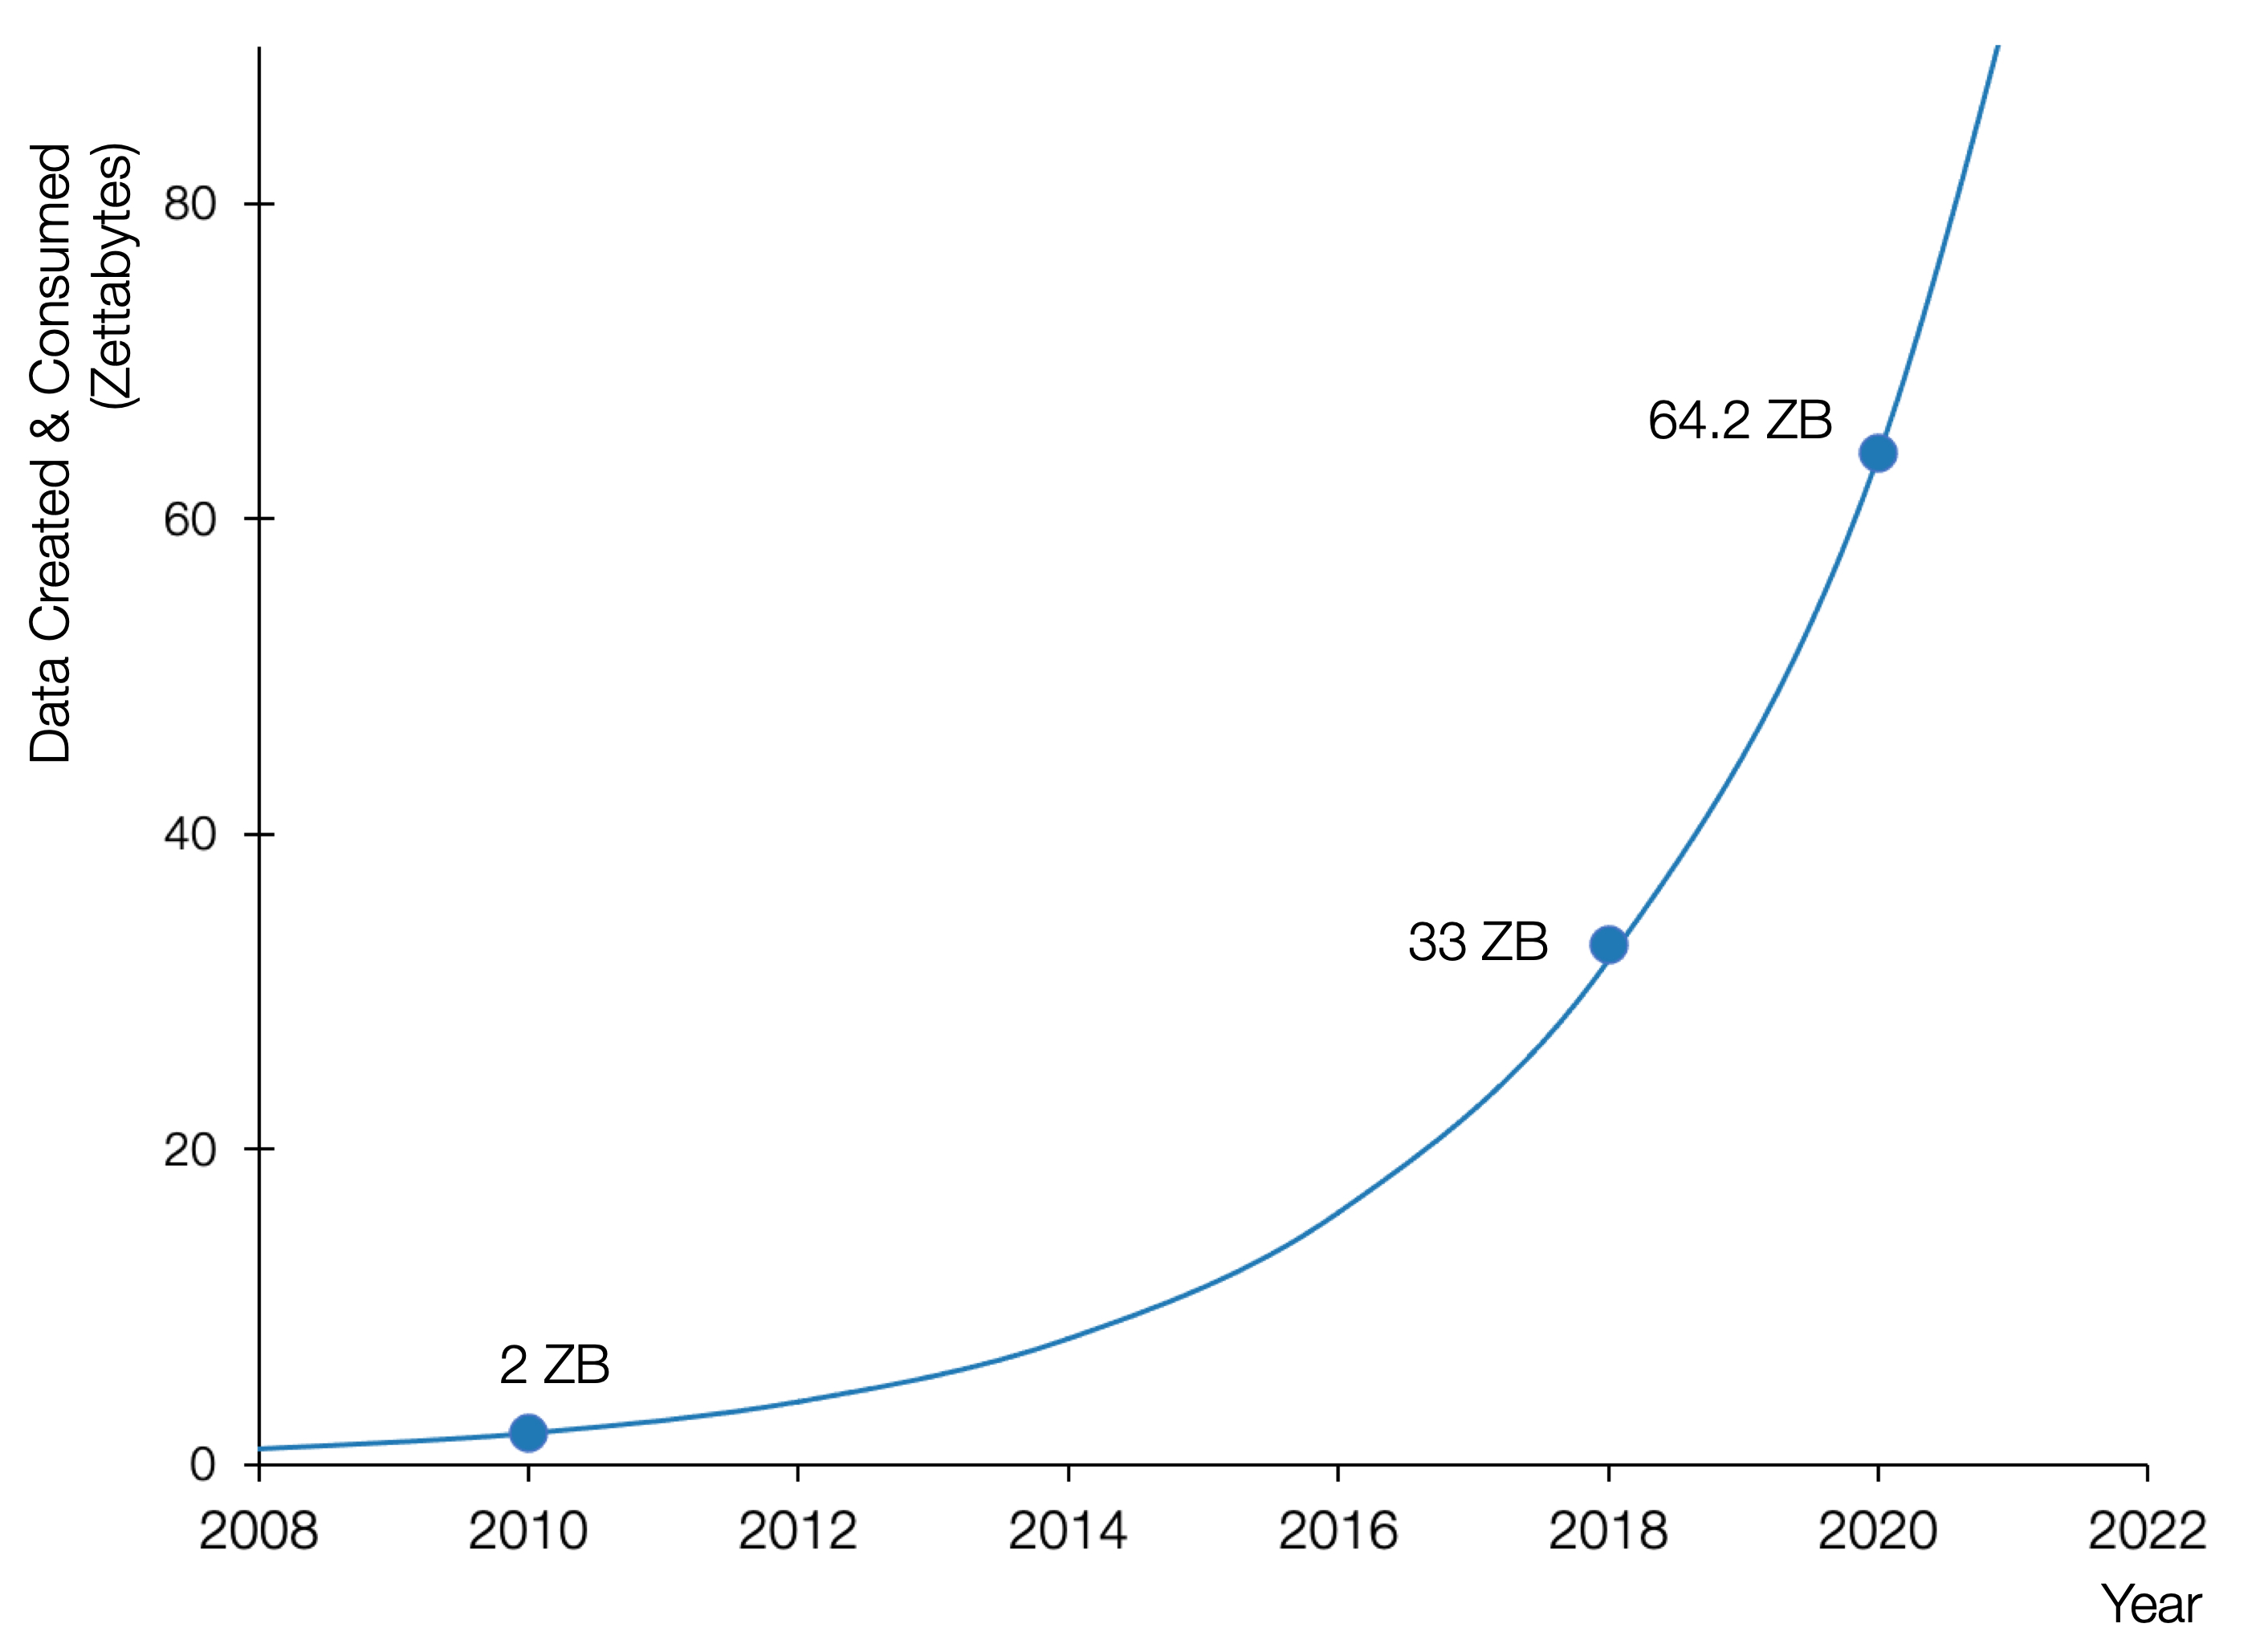
Most introductory courses on data science begin with a chart similar to the one below, which shows an exponential growth in data followed by the statement: “we are drowning in data!” Regardless of how the figures are estimated, we can largely agree that the estimate’s order of magnitude is plausible and we can relate to the overwhelming feeling of being reduced individually to data streams that are intensively mined and analyzed by all forms of organizations, corporations and institutions. Your social media accounts, email, search history, shopping habits both online and offline, videos viewed, podcasts and music heard, health and fitness measurements, rides shared, are all examples of the data that you personally generate and is collected, aggregated and shared by a whole data ecosystem of data consumers, brokers and analysts. We can also relate to our world’s new data-literacy expectations: careers in data science and artificial intelligence are now marketed as the ways of the future.
And yes, as optimists we agree that the future of data science is bright: data can inform and empower many of our most important societal decisions. In an epidemic, we can gather and analyze data to determine how effective are our vaccinations or how transmissible is a disease. We can use data to determine what is the impact of emissions on global warming and which planet-saving projects should we focus on when tackling climate change1. Data can directly inform our personal decisions: how much is a fair rental price? how much time should I spend on exercising and when should I do it? In short, data can give us an edge when formulating many of our difficult decisions.
But putting on our skeptical hats, we also agree with the alternative perspective on our data-driven world: “we are drowning in bull$#^!” In their book Calling Bullshit, Bergstrom and West provide a detailed account of how misinformation is propagated under the artifice of data-driven findings and quantitative methods. As critical thinkers, we should be comfortable interrogating any data-driven or statistical finding, and any complex artificial-intelligence prediction to call out not only inaccuracies but also straight-up lies.
What is this course about?
For an outline of the course expectations and plan, please take a look at the course syllabus.
This course is not:
- an introduction to data science and artificial intelligence
- an introduction to visualization
- an introduction to applied statistics
While we do touch on some of the material that the above introductory courses typically introduce, our primary focus is on developing the skill set required for critical data-driven thinking.
Data Power?
In this fun video, Hans Rosling of the Gapminder foundation illustrates how our intuition on many global issues trails behind that of chimps!
Hans Rosling is an advisor to many of our world leaders and he believes in the power of data and data visualization in helping us understand and possibly change the world.
While our goal is provide you with a basic skill set to begin tackling issues large and small with data, a more crucial goal of this course is to recognize our data hubris.
Data Hubris?
Do you agree with the viewpoint shared above?
If yes, you are not alone. This viewpoint is becoming disturbingly ever prevalent. AI initiatives are pushing us even further into using “big” data for all kinds of issues and problematically many of those “big” data sources are data sets collected by social media and online-tech platforms.
Here is a case study to understand the tensions at play
Imagine you are a data scientist at google sitting on a mountain of rich data: the search history of billions of individuals across the world. You care about the world and you think: *can I use the data to predict the next epidemic outbreak?” Perhaps, certain search term trends (e.g an increase in the frequency of search terms “fever”, “chills”, “red toes”, …) can accurately predict an outbreak, giving policy-makers a better chance at handling it.
This is exactly what a team of google researchers and academics sought out to create in 2009 and they built Google Flu Tracker (GFT).
“Detecting influenza epidemics using search engine query data” by Ginsberg et al.
GFT became defunct in 2014 failing miserably at estimating flu-like doctor visits. Why? Read the paper below to understand some of the limitations of how the tracker worked and how to improve it.
“The Parable of Google Flu: Traps in Big Data Analysis” by Lazer et al.
An epilogue to the Google Flu Tracker Saga: “Google Searches Can Help Us Find Emerging Covid-19 Outbreaks” or online here by Seth Stephens-Davidowitz, author of “Everybody Lies: Big Data, New Data, and What the Internet Can Tell Us About Who We Really Are.”
Drowning in Data or BS?
Exercise 1, Part 1: The Data Journal. Your first assignment for this course is to track your daily exposure to stories that have some form of data-backed claim to them.
Exercise 1, Part 2: Visualizing The Data Journal Journal A peek into what follows from the first part.