1 Think
Week 1: January 24-31, 2022
“The point of modern propaganda isn’t only to misinform or push an agenda. It is to exhaust your critical thinking to annihilate truth.”
Garry Kasparov, Chess grandmaster
1.1 To Vaxx or Not To Vaxx?
In class, we went through the critical thinking process of trying to determine whether a certain data-backed claim holds water. We investigated a series of tweets and posts on COVID-19 vaccinations. For each of those, we tried to extract the central data finding, the arguments offered by the authors in favor of the finding and posit likely alternative explanations. Here is a quick summary:
“Alberta COVID-19 dashboards shows a high percentage of hospitalized individuasl are vaccinated.” The author explains this observation by questioning the success of the vaccine passport program in Alberta. In our investigation we went to the primary data source, the dashboard, and found the reported data to be accurate. However, by Jan 1, 2022 roughly 80% of the population had received at least 1 dose and more than 70% received 2 doses. This brings up the base rate fallacy: the likely explanation for the observation is that there is a larger proportion of the population that is vaccinated and so even though a smaller proportion of vaccinated will end up in the hospital, there would still be more of them in the hospital than unvaccinated individuals. This explanation was corroborated by examining the rates of hospitalized per 100K for each group later in the dashboard.
“The Pfizer vaccine suppresses immunity.” The author cites a figure from the peer-reviewed “Pfizer article”2 that consistently shows a drop in lymphocytes two days after the administration of different vaccine doses across all patients. We discussed how it is difficult to interpret results that are outside our domain of expertise. We did examine the primary source and found the full figure, which showed an increase in Neutrophils and an explanation by the authors of the observation: “No clinically significant changes in routine clinical laboratory values occurred after BNT162b2 vaccination. In line with previous reports for RNA-based vaccines … a mild drop of blood lymphocyte counts (without concomitant neutropenia) and an increase in C-reactive protein (CRP) were observed, both transient, dose-dependent and within or close to laboratory normal levels (Extended Data Fig. 3). Both effects are considered pharmacodynamic markers for the mode-of-action of RNA vaccines: blood lymphocyte counts transiently decrease as the lymphocytes redistribute into lymphoid tissues in response to innate immune stimulation[17], and CRP is a downstream effect of innate immune modulation [18–21].” We also noted the lack of an alarmed response by the scientific community with respect to this observation.
“Vaccine effectiveness is 37% based on an Ontario study, which falls below the 50% vaccine efficacy standard set by the FDA for acceptance.” The author, an associate professor of epidemiology, asks why are we requiring boosters in light of this finding. We examined the distinction between the two measures: effectiveness is based on the observed reduction in risk in the population in the wild, whereas efficacy is based on the observed reduction in controlled trials. The former opens up the possibility of uncontrolled confounding factors. We would expect effectiveness to be different from efficacy. We also noted that vaccine efficacy results may be outdated in light of new variants like Omicron.
“The same Ontario study shows a paradoxical finding of negative vaccine effectiveness after two doses but positive vaccine effectiveness after three doses.” We note that the article was not peer-reviewed and is a pre-print. While widely circulated in the press, the authors have issued a statement: “We’re in the process of adding two more weeks of data and it looks like there’s no more negative VE (vaccine effectiveness). Our results are now more in line with the data from the U.K. where it’s lower, for sure, compared to Delta, but never getting to negative, … And then higher VE with the boost. So I think that’s good news and we’re just in the process of running those analyses and we hope to have an updated version, a version two, by sometime next week.” So faulty data seems to be the likely explanation of the finding. Even if the data did not appear to be faulty, we discussed how this finding might be an outcome of confounding human testing/screening behaviors in the different vaccinated vs un-vaccinated population sub-groups.
“Extraordinary claims require extraordinary evidence”
Carl Sagan, Astronomer, Science Communicator, Creator of Cosmos
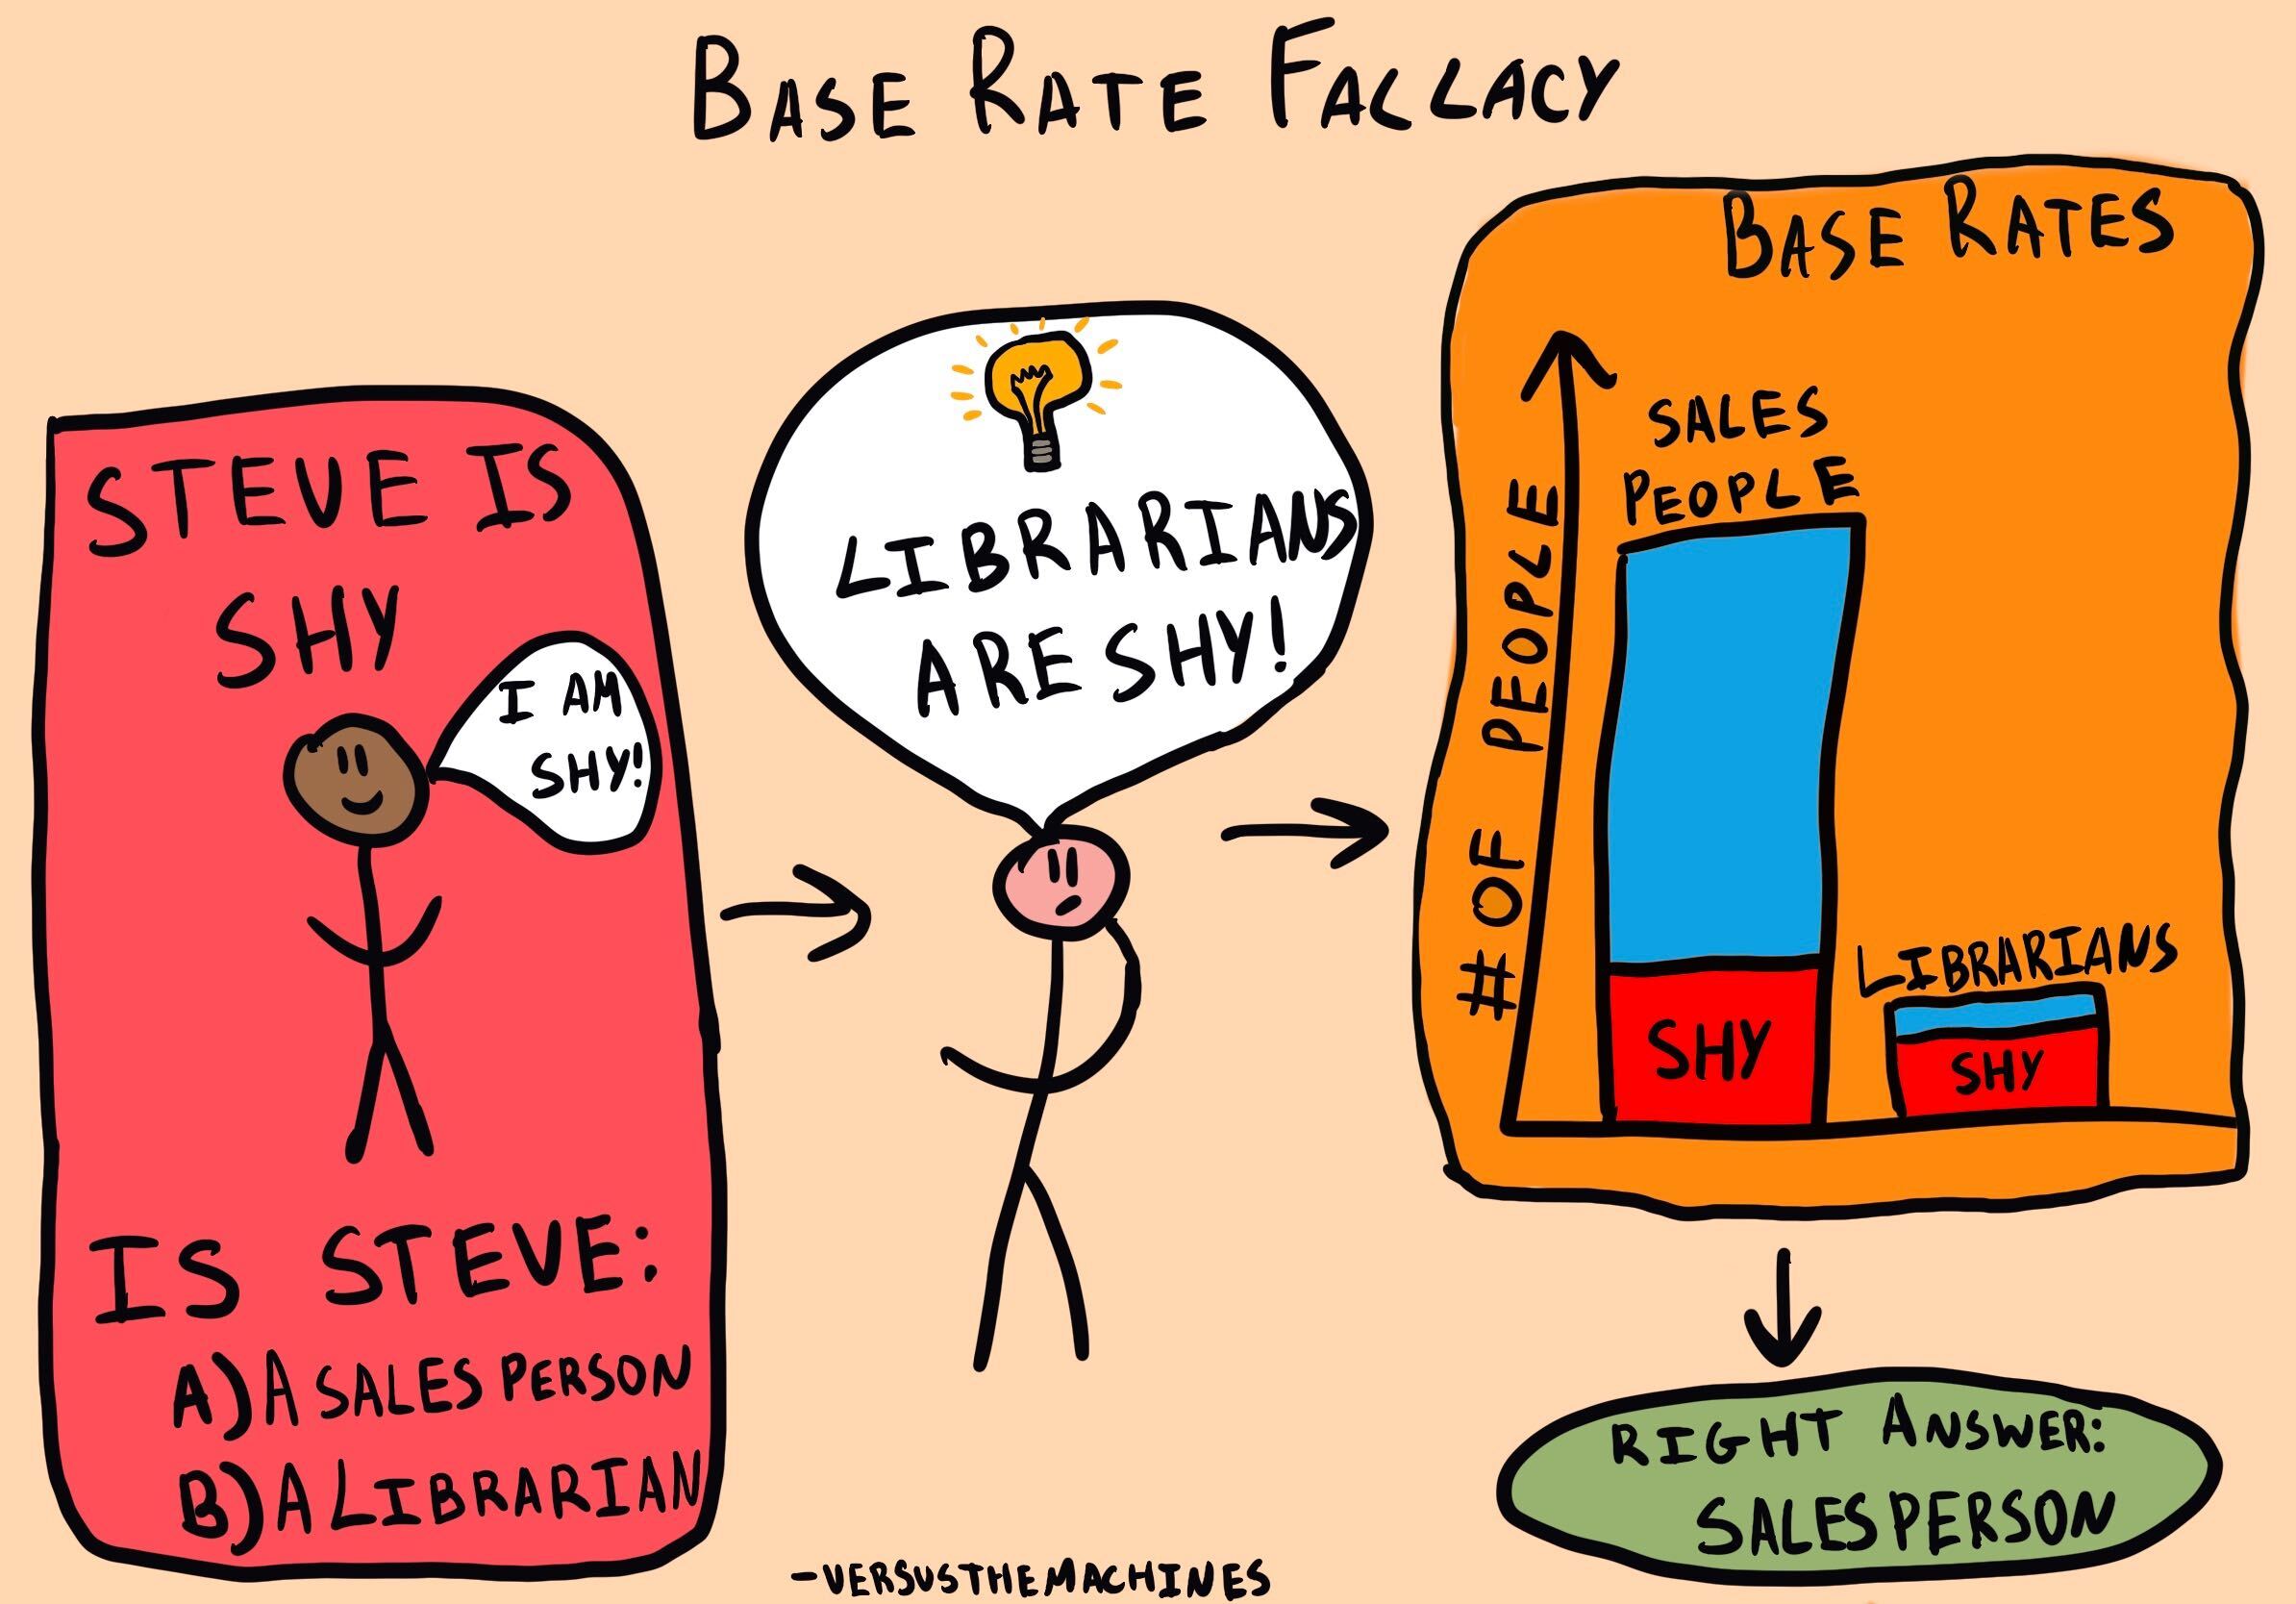
1.2 What is the base rate fallacy?
You are at the annual meet-up of sales-persons and librarians. As an organizer of the event you have access to the attendance data. While not necessarily representative of the entire population of sales persons and libraries — those are individuals who self-select to show up to this meet-up —, it is the best sample you have of this population.
You have 90 sales-persons and 10 librarians.
You are introduced to Steve and told that he is a shy person. You recall a facebook post that gave some stats on shyness and different professions. It said 60% of librarians are shy and only 11% of sales-persons are shy. What is Steve’s profession?
An example of the base rate fallacy would be if one responds “librarian” because 60% of librarians are shy, while only 11% of sales-person are shy. Only considering the high probability of librarians being shy, they jumped to this conclusion and ignored the low base rate of individuals being librarians in the first place in this meetup.
You should use all the information you have.
- The probability of being a librarian \(P(lib)\) in this conference is 0.1.
- The probability of being a sales person \(P(sales)\) is 0.9.
But not too fast because, you still should consider that Steve is shy so what you want are the conditional probabilities: \(P(lib|shy)\) and \(P(sales|shy)\).
How do we compute these? Using Bayes theorem
- \(P(lib|shy) = \frac{P(shy|lib)\times P(lib)}{P(shy)} = \frac{0.6 \times 0.1}{0.16} = 0.375\)
- \(P(sales|shy) = \frac{P(shy|sales)\times P(sales)}{P(shy)} = \frac{0.11 \times 0.9}{0.16} = 0.625\)
- \(P(shy) = P(shy|lib)P(lib) + P(shy|sales)P(sales) = 0.16\)
Given the high base rate of sales persons in the meetup, even though Steve is shy, he is more likely to be a sales person than a librarian.
This example was motivated by this image from the decision lab.
1.3 Hot Take
Recently, the National featured a headset that claims to help reverse diabetes and obesity. Read the article’s claims and engage in the critical thinking process yourself.
Here to help you make sense of the article is expert scientist and NYUAD professor Bas Rokers.
1.4 Relax, You Look Criminal
Can machine learning be used to detect criminality from facial features. In class, we examined this work, which builds on the sordid history of physiognomic criminology. To get you to understand the nuances, arguments and counter-arguments of this form of data-driven predictions, the following is required reading.